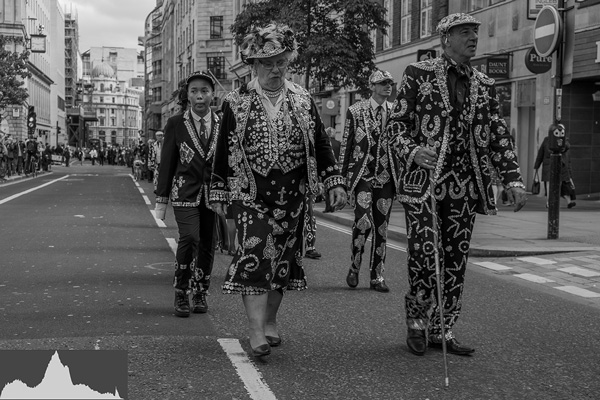
One of the tools most frequently overlooked by beginner and improving photographers is the histogram. The histogram is full of information that you can use to make your photographs more interesting to the viewer. In this article, you’ll discover how to make sense of your camera’s histogram and learn a great technique to take advantage of that information.
What Is A Histogram?
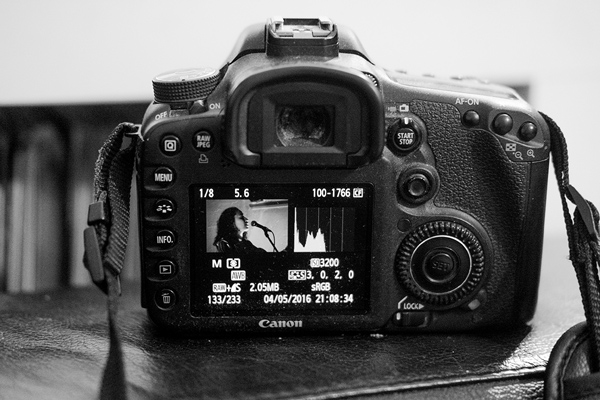
In photography, a histogram is a graph showing the distribution of light in an image. Most cameras are capable of displaying a histogram for each image stored on the camera’s memory card.
Some cameras even allow you to see a live histogram before you take the shot. The features vary from camera to camera, so consult your camera manual to find out how to display the histogram on your camera.
Your image is made up of millions of pixels, and every pixel has a value representing its color. The pixel’s brightness is derived from this value. A histogram shows you the number of pixels of each brightness in your image.
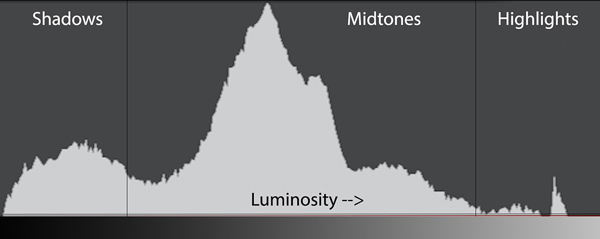
The scale along the bottom of the histogram goes from left to right, from 0% brightness (black) to 100% brightness (white). The taller the peak, the more pixels of that brightness there are in the image.
In the example histogram above, you can see that most of the pixels have a medium brightness (the mountain peak in the “Midtones” region). There are quite a lot of darker pixels (in the “Shadows” region), and very few brighter pixels in the “Highlights” region.
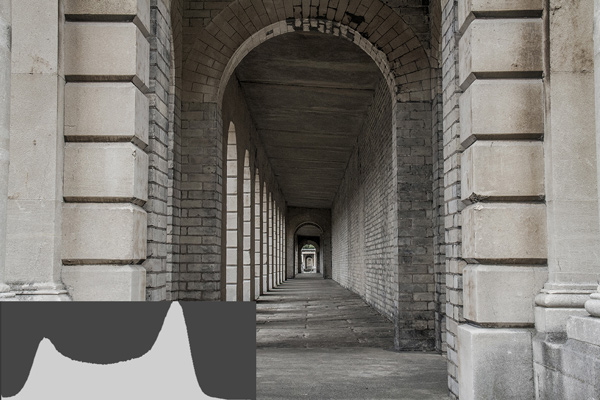
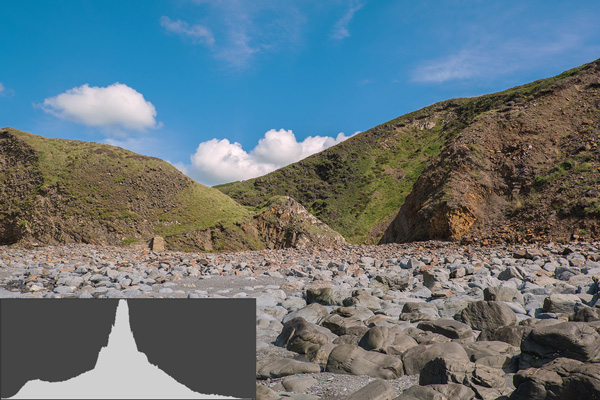
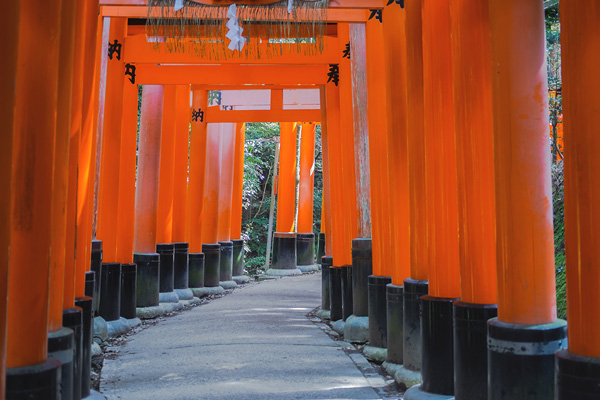
The image below has a histogram showing that most of the pixels are of medium brightness. There are two spikes in the histogram – the leftmost spike representing the darker regions of the image, and the rightmost spike representing the lighter regions – mainly the light-colored block pillars framing the shot.
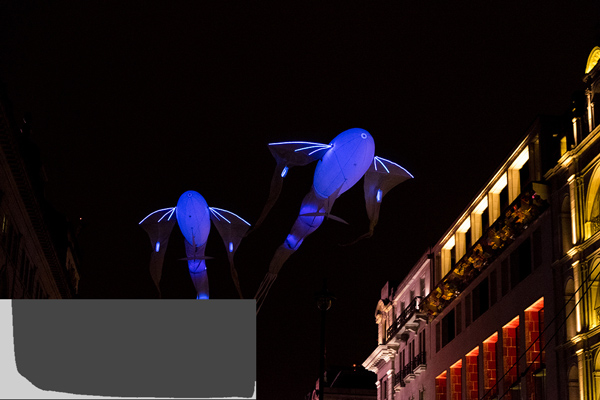
The photo below has a histogram which shows how most of the image’s pixels are dark or pure black. There’s a tiny little spike to the extreme right, which relates to the bright white highlights at the top of the brightly lit windows on the top floor of the building.
Understand What Your Histogram Is Telling You
Now that you understand the basics of reading a histogram, let’s look at what it’s telling you about your image.
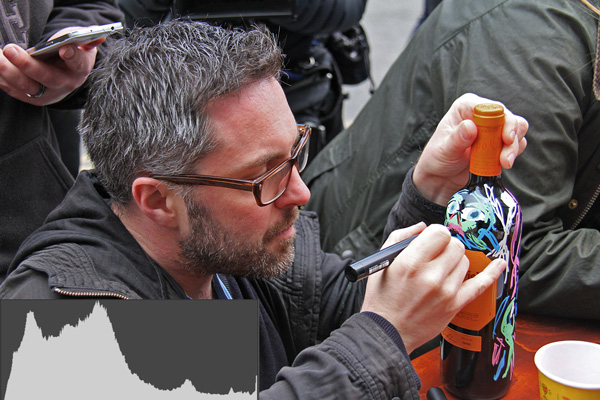
Most shots will contain a high number of pixels in the mid-tones. These will cluster around the central area of the graph. The higher the level of contrast in the image, the fewer pixels will appear in the middle.
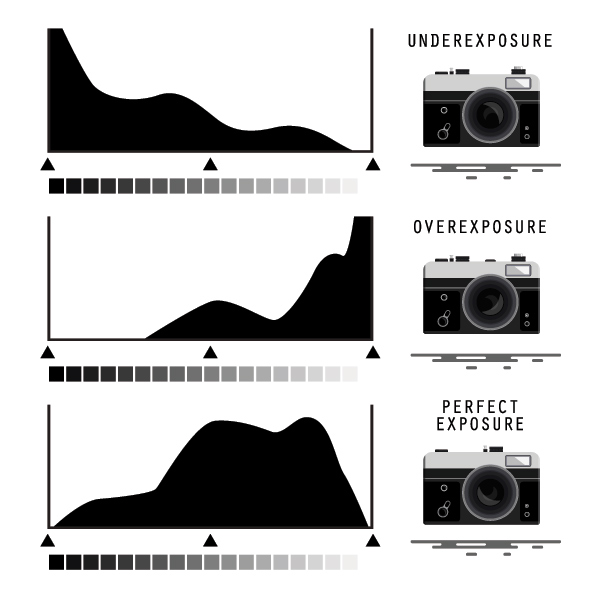
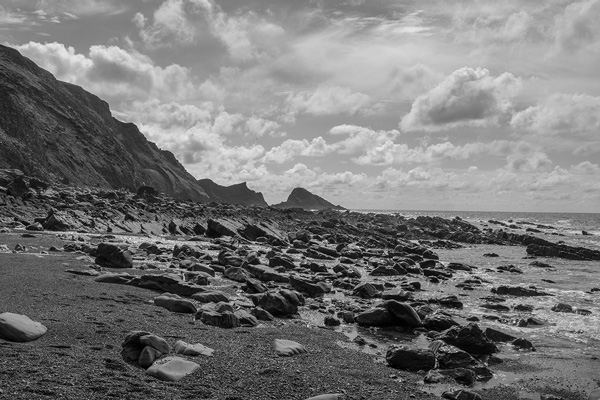
In the example below, most of the pixels are at the dark end of the scale, with few bright pixels.
One of the most common uses of a histogram is to check for clipping.
Clipping is where a region of your photo is too dark (under-exposed) or too light (over-exposed) for the sensor to capture any detail in that region.
When clipping occurs at the right-hand side of the histogram, it’s called blowing out the highlights.
Clipping is difficult to spot without a histogram, but with a histogram, it’s very easy. You’ll see a large spike on the histogram graph right up against the left or right side of the graph.
No detail about your photo is captured beyond these extremes. Therefore, clipping is undesirable, and no amount of post-editing can recover detail that simply wasn’t captured by the camera.
Change How You Think About Exposure
An exposure is the combination of several camera settings found in the exposure triangle, but in simplistic terms, it’s how bright or dark the captured image is.
There is no single correct exposure for a scene but most photographers aim to capture the scene as they see it in front of them. While this seems sensible, it won’t always give you the best exposure if you want to achieve the best possible end result.
This naturalistic approach is great for snapshots and will work fine for photographers who don’t intend to post-process their images. But if you are willing to spend a little time working with the image in post-edit, using Lightroom or Photoshop, for example, then the technique you’re about to discover you can bring far better results.
So, let’s look at that technique now. It’s called Expose To The Right.
What Is Exposing To The Right?
Photographers normally aim for a reasonably balanced histogram with the traditional bell-shaped curve, as shown below.
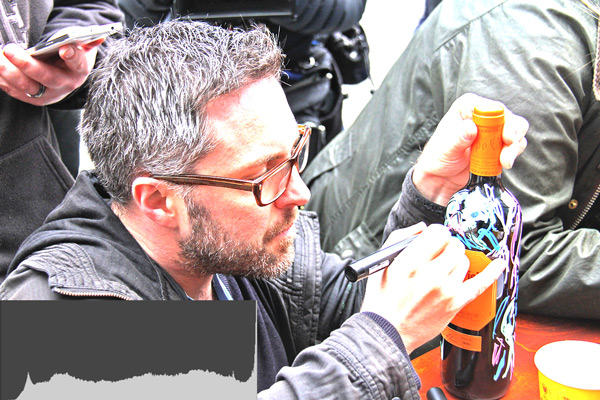
Expose to the right means exposing your image to push the peaks of the histogram as near to the right side of the graph as possible without clipping the highlights. Then, in your favorite photo editing suite, the shot is then processed to reduce the brightness and bring the final image back to your desired exposure.
The Benefits Of Exposing To The Right
Exposing to the right is beneficial because the further to the right you go, the more distinct tonal values there are. This produces a wider dynamic range. Dynamic range is the camera’s ability to capture both dark and light regions of the scene and everything in between.
You can easily check the claim that images exposed to the right contain more detail than those exposed to the left. Simply take two identical photos of the same scene, but, using your camera’s exposure compensation dial, drastically under-expose one of them.
Now, check the file sizes of both images. The properly exposed image will have a larger file size than the under-exposed image. This demonstrates how much more data your image holds when exposing to the right, rather than the left.
Bright light has more energy than low light, making it easier for the sensor to capture it. This results in a higher signal-to-noise ratio. This is because bright light generates a strong electrical signal in the camera’s sensor. This overpowers the relatively weak electrical signals created by random electronic interference found in all electronic devices.
Exposing to the right, but being sure not to clip the highlights, results in images which are less noisy, have greater dynamic range, a higher signal-to-noise ratio, and better colors.
Choose The Right File Format
When your camera takes a photo, it saves it as a file on your camera’s memory card. The two most common image file formats are JPEG and RAW.
RAW is a lossless file format which keeps all of the information captured by your sensor. It’s an exact copy of what the sensor captured, without any image adjustments or enhancements.
By comparison, the JPEG format compresses the sensor information, throwing away detail which you can never get back. This keeps the image file size small but at the expense of image quality.
As the price of memory and storage falls constantly, image file sizes are less important. So, always shoot RAW if your camera allows it.
Brighten Your Image The Right Way
Exposing to the right involves making the image brighter. There are several ways to do this in-camera. Refer to the exposure triangle to discover how to adjust aperture, shutter speed, and ISO for a brighter image. Avoid increasing the ISO value, as the increased grain will counteract any benefits you’ll get from exposing to the right.
Keep the ISO as low as it will go. Only make changes to aperture or shutter speed. Be aware that changes to shutter speed might introduce camera shake. If you choose to use a slower shutter speed, consider using a tripod and timer for best results.
A quick way to brighten the image is to use your camera’s exposure compensation dial. This allows you to increase or decrease the exposure in small increments.
Turn the dial to a positive number (e.g. +1/3, +1/5, +1 or +2) and take a test shot. Then check the histogram for the photo you just took. If the histogram is stacked hard up against the right-hand side of the graph, reduce the exposure compensation, and take another test shot.
Use Bracketing To Speed Up Your Workflow
In-camera histograms use a JPEG version of the image, even if you’re shooting in RAW only. Sometimes this results in the histogram incorrectly warning you about clipping. Despite this, the information lost in the JPEG version is potentially still available in the RAW file. It’s a small point, but a reminder that the histogram isn’t the whole story.
Exposure bracketing can help with this problem. It allows you to take multiple photos at different exposures. One normally exposed photo, one over-exposed photo, and one underexposed.
The three photos below were created automatically with exposure bracketing. They include a normally exposed image, an over-exposed image, and an under-exposed image.
Using exposure bracketing increases the chances of getting the best exposure, even if the histogram is slightly misleading.
Summary
A histogram is a useful tool for understanding and accurately exposing your images. Correctly reading the histogram lets you make informed decisions about adjusting the exposure while you’re still out in the field. Once you get home, it’s too late!
Exposing to the right, but being sure not to clip the highlights, results in better quality images. Your images will be less “noisy”, have greater dynamic range, a higher signal-to-noise ratio, and better colors.

